5 Flow cytometry
NOTICE:
This chapter is
in progress.
Flow cytometry data can be quantified in many different ways and with different techniques. For the purpose of these data analyses, manual gating has been achieved in FlowJo and cell frequencies and populations exported as a .csv file. This .csv file is the primary input for this R pipeline which aims to output box plots for each gated cell population.
This example data set is from an innate response study whcih investigated the immune response in the lungs during the first 28 days of infection.
Immune cells are very diverse, and the make-up of immune cells within a sample can provide important insights on immune processes based on measures of this composition. Immune cells can be categorized into large groups (e.g., T cells, B cells, macrophages, dendritic cells). They can also be characterized into different populations within these large groups, based on things like activation and differentiation [?] within the group [?] (Maecker, McCoy, and Nussenblatt 2012) (e.g., T cells can be divided into naive T cells versus memory T cells, helper T cells versus cytotoxic T cells, [others] [?]). This process of characterizing the immune cells in a sample is called immunophenotyping.
To make these classifications, flow cytometry uses a pretty clever mix of physics and biology. First, it starts by leveraging the biological knowledge that antibodies can have a very specific affinity for a certain protein. This means that you can find a set of antibodies that will target and stick specifically to certain proteins.
Flow cytometry starts by creating a panel of up to [x] protein markers, focusing on proteins that can help in identifying a specific cell type. Typically, the panel will include several proteins that are “CD” proteins (the “CD” stands for cluster of differentiation or classification determinant). These are proteins that show up on the surface of immune cells, with specific CD proteins common to only certain types of cells, making their presence or absence helpful in classifying cells.
Two of the most common CDs to include on a panel are CD3, CD4, and CD8. T cells have CD3 on their surface, so a marker for CD3 can be used to distinguish T cells from other types of white blood cells, including granulocytes, monocytes, and B cells. Among T cells, the helper T cells have the CD4 protein on their surface, while the cytotoxic T cells have the CD8 protein on their surface, so the CD4 and CD8 markers can help in refining a T cell into a more specific type.
In flow cytometry, you can characterize immune cells into populations based on proteins on the cell surface and inside the cell, as well as cell size and granularity Barnett et al. (2008). For example, macrophages can be distinguished from T cells and B cells based on … [size? granularity?], which T cells and B cells can be distinguished from each other based on whether the cell has the [surface protein? CD3?], and helper T cells versus cytotoxic T cells can be distinguished from each other based on whether the cell has the [surface protein CD8? CD4?].
5.2 Loading data
## # A tibble: 64 × 30
##    Sample          sex    day   `CD3+ ` `CD3+ CD4+ ` `CD3+ CD4+  CD62L-  CD44+ `
##    <chr>           <chr>  <chr>   <dbl>        <dbl>                       <dbl>
##  1 " Saline_1.fcs" female 14       30          14.1                         5.19
##  2 " Saline_2.fcs" female 14       29.5        12.4                         2.47
##  3 " Saline_3.fcs" female 14       26.7        12.6                         4.86
##  4 " Saline_4.fcs" female 14       17.2         7.2                         3
##  5 " BCG_1.fcs"    female 14       43.2        24.9                        14.8
##  6 " BCG_2.fcs"    female 14       11.7         6.42                        1.45
##  7 " BCG_3.fcs"    female 14       24.1        13.5                         4.59
##  8 " BCG_4.fcs"    female 14       41.2        24                          10.2
##  9 " ID93_1.fcs"   female 14       38.9        24.2                        11.9
## 10 " ID93_2.fcs"   female 14       34.2        18.9                        10.1
## # ℹ 54 more rows
## # ℹ 24 more variables: `CD3+ CD4+  CD62L-  CD44+  PD1-  KLRG1+ ` <dbl>,
## #   `CD3+ CD4+  CD62L-  CD44+  PD1+  KLRG1+ ` <dbl>,
## #   `CD3+ CD4+  CD62L-  CD44+  PD1+  KLRG1- ` <dbl>,
## #   `CD3+ CD4+  CD62L-  CD44+  PD1-  KLRG1- ` <dbl>,
## #   `CD3+ CD4+  CD62L+  CD44+ ` <dbl>, `CD3+ CD4+  CD62L+  CD44- ` <dbl>,
## #   `CD3+ CD4+  CD62L+  CD44-  PD1-  KLRG1+ ` <dbl>, …
## Sample sex
## 0 0
## day CD3+
## 0 0
## CD3+ CD4+ CD3+ CD4+ CD62L- CD44+
## 0 0
## CD3+ CD4+ CD62L- CD44+ PD1- KLRG1+ CD3+ CD4+ CD62L- CD44+ PD1+ KLRG1+
## 0 0
## CD3+ CD4+ CD62L- CD44+ PD1+ KLRG1- CD3+ CD4+ CD62L- CD44+ PD1- KLRG1-
## 0 0
## CD3+ CD4+ CD62L+ CD44+ CD3+ CD4+ CD62L+ CD44-
## 0 0
## CD3+ CD4+ CD62L+ CD44- PD1- KLRG1+ CD3+ CD4+ CD62L+ CD44- PD1+ KLRG1+
## 0 0
## CD3+ CD4+ CD62L+ CD44- PD1+ KLRG1- CD3+ CD4+ CD62L+ CD44- PD1- KLRG1-
## 0 0
## CD3+ CD4+ CD62L- CD44- CD3+ CD8+
## 0 0
## CD3+ CD8+ CD62L- CD44+ CD3+ CD8+ CD62L- CD44+ PD1- KLRG1+
## 0 0
## CD3+ CD8+ CD62L- CD44+ PD1+ KLRG1+ CD3+ CD8+ CD62L- CD44+ PD1+ KLRG1-
## 0 0
## CD3+ CD8+ CD62L- CD44+ PD1- KLRG1- CD3+ CD8+ CD62L+ CD44+
## 0 0
## CD3+ CD8+ CD62L+ CD44- CD3+ CD8+ CD62L+ CD44- PD1- KLRG1+
## 0 0
## CD3+ CD8+ CD62L+ CD44- PD1+ KLRG1+ CD3+ CD8+ CD62L+ CD44- PD1+ KLRG1-
## 0 0
## CD3+ CD8+ CD62L+ CD44- PD1- KLRG1- CD3+ CD8+ CD62L- CD44-
## 0 0MULTIDAY SHEETS FOR EXCEL
SINGLE SHEETS Loading data
MAKING DATA TIDY FOR PLOTTING
## # A tibble: 1,728 × 6
##    group  mouse_ID sex    day   cell_types                    percentage_of_LIVE
##    <chr>  <chr>    <chr>  <chr> <chr>                                      <dbl>
##  1 Saline 1        female 14    CD3+                                    30
##  2 Saline 1        female 14    CD3+ CD4+                               14.1
##  3 Saline 1        female 14    CD3+ CD4+ CD62L- CD44+                   5.19
##  4 Saline 1        female 14    CD3+ CD4+ CD62L- CD44+ PD1- …            0.42
##  5 Saline 1        female 14    CD3+ CD4+ CD62L- CD44+ PD1+ …            0.24
##  6 Saline 1        female 14    CD3+ CD4+ CD62L- CD44+ PD1+ …            1.87
##  7 Saline 1        female 14    CD3+ CD4+ CD62L- CD44+ PD1- …            2.66
##  8 Saline 1        female 14    CD3+ CD4+ CD62L+ CD44+                   0.72
##  9 Saline 1        female 14    CD3+ CD4+ CD62L+ CD44-                   3.9
## 10 Saline 1        female 14    CD3+ CD4+ CD62L+ CD44- PD1- …            0.00482
## # ℹ 1,718 more rows
## tibble [1,728 × 6] (S3: tbl_df/tbl/data.frame)
## $ group : chr [1:1728] "Saline" "Saline" "Saline" "Saline" ...
## $ mouse_ID : chr [1:1728] "1" "1" "1" "1" ...
## $ sex : chr [1:1728] "female" "female" "female" "female" ...
## $ day : chr [1:1728] "14" "14" "14" "14" ...
## $ cell_types : chr [1:1728] "CD3+" "CD3+ CD4+" "CD3+ CD4+ CD62L- CD44+" "CD3+ CD4+ CD62L- CD44+ PD1- KLRG1+" ...
## $ percentage_of_LIVE: num [1:1728] 30 14.1 5.19 0.42 0.24 1.87 2.66 0.72 3.9 0.00482 ...CHECK FIRST ASSUMPTION IN STATS (Independent obervations)
##  [1] "CD3+"                               "CD3+ CD4+"
##  [3] "CD3+ CD4+ CD62L- CD44+"             "CD3+ CD4+ CD62L- CD44+ PD1- KLRG1+"
##  [5] "CD3+ CD4+ CD62L- CD44+ PD1+ KLRG1+" "CD3+ CD4+ CD62L- CD44+ PD1+ KLRG1-"
##  [7] "CD3+ CD4+ CD62L- CD44+ PD1- KLRG1-" "CD3+ CD4+ CD62L+ CD44+"
##  [9] "CD3+ CD4+ CD62L+ CD44-"             "CD3+ CD4+ CD62L+ CD44- PD1- KLRG1+"
## [11] "CD3+ CD4+ CD62L+ CD44- PD1+ KLRG1+" "CD3+ CD4+ CD62L+ CD44- PD1+ KLRG1-"
## [13] "CD3+ CD4+ CD62L+ CD44- PD1- KLRG1-" "CD3+ CD4+ CD62L- CD44-"
## [15] "CD3+ CD8+"                          "CD3+ CD8+ CD62L- CD44+"
## [17] "CD3+ CD8+ CD62L- CD44+ PD1- KLRG1+" "CD3+ CD8+ CD62L- CD44+ PD1+ KLRG1+"
## [19] "CD3+ CD8+ CD62L- CD44+ PD1+ KLRG1-" "CD3+ CD8+ CD62L- CD44+ PD1- KLRG1-"
## [21] "CD3+ CD8+ CD62L+ CD44+"             "CD3+ CD8+ CD62L+ CD44-"
## [23] "CD3+ CD8+ CD62L+ CD44- PD1- KLRG1+" "CD3+ CD8+ CD62L+ CD44- PD1+ KLRG1+"
## [25] "CD3+ CD8+ CD62L+ CD44- PD1+ KLRG1-" "CD3+ CD8+ CD62L+ CD44- PD1- KLRG1-"
## [27] "CD3+ CD8+ CD62L- CD44-"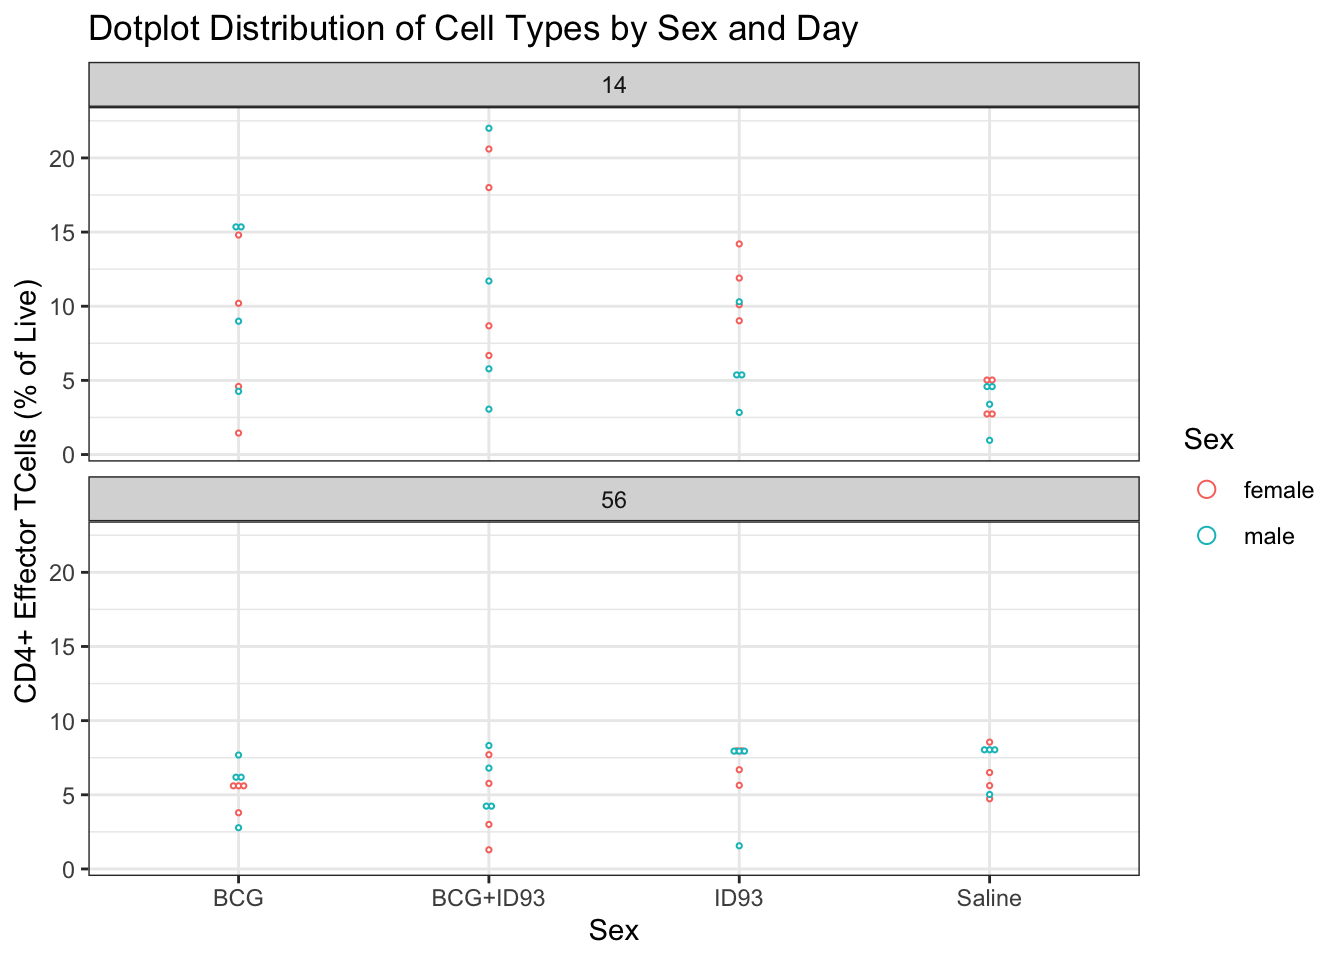
CHECKING EQUAL VARIANCES OF POPULATION OF INTEREST
## Levene's Test for Homogeneity of Variance (center = mean)
##       Df F value    Pr(>F)
## group  7  8.3438 6.034e-07 ***
##       56
## ---
## Signif. codes:  0 '***' 0.001 '**' 0.01 '*' 0.05 '.' 0.1 ' ' 1
##
## Bartlett test of homogeneity of variances
##
## data: percentage_of_LIVE by interaction(group, day)
## Bartlett's K-squared = 36.214, df = 7, p-value = 6.605e-06WORKING ON STATS June 1, 2023
EXPLORATORY ANALYSIS
## [1] "Saline" "BCG" "ID93" "BCG+ID93"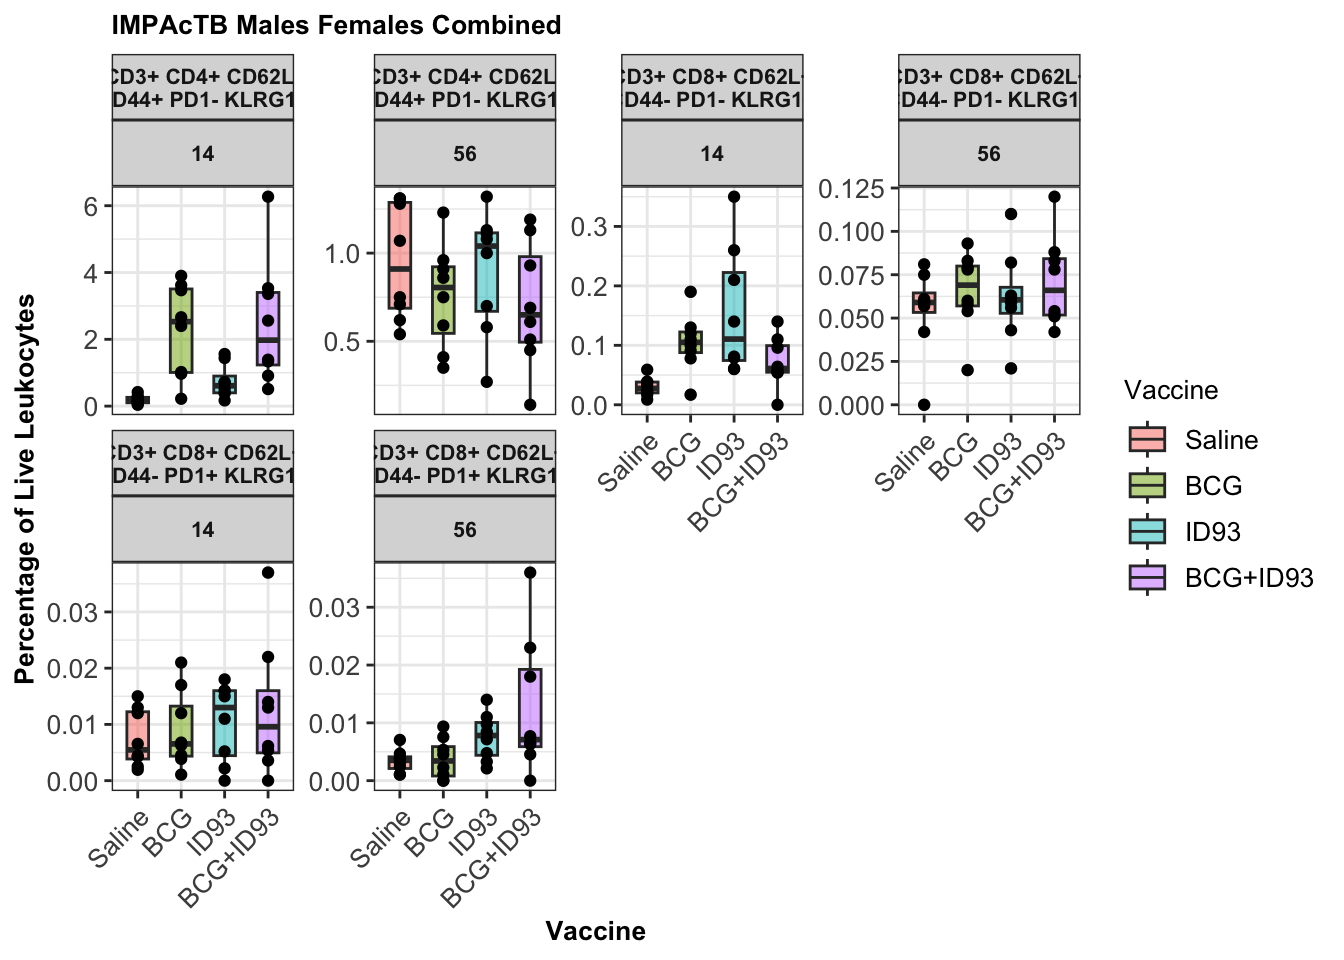
WORKING ON THIS
Saving plots to PDF
Looking at specific populations